Saturday, November 19, 2011
Ch P Graphing Functions By Stephanie Ratio
The Ch. 0 Graphing Functions Project demonstrated how there are several different transformations for each of the five parent functions.
The original parent function is y = |x|, shown in the dark teal. The vertical translation, y = |x| -1, is the blue graph. y=|x| is shifted vertically down by 1 unit. The horizontal translation, y= |x-5|, is the purple graph. y=|x| is shifted horizontally to the left by 5 units. The vertical & horizontal translation, y = |x-2|+4, is the red graph. y=|x| is shifted vertically 2 units to the right and shifted horizontally 4 units up. The horizontal reflection, y = -|x| , is the green graph. y=|x| is flipped across the x-axis, making both the functions symmetric. The vertical & horizontal translation & reflection, y = -|x-6|-7, is the pink graph. y=| x | is reflected across x-axis, shifted horizontally to the right 6 units, and shifted vertically down 7 units. The vertical shrink, y = -2|x-3|+1, is the darker pink graph. There is a reflection over x-axis, a horizontal shift to the right 3 units, a vertical shift up 1 unit, and a vertical shrink by -2.
Thursday, November 17, 2011
About Me
Hi my name is Erika Huang.
Some previous schools I have attended are: Cleveland Elementary, Edna Brewer Middle School, and CSU Cal Maritime.
I am currently working at 4 different programs this year: PASS2 Mentors(where I work along with students at school to help peer mentor freshman, especially with graduation requirements), Da Town Researches (I go to many different public schools in Oakland and do a school quality review on specific schools then we try to help better those schools), AYPAL Campaign Organizing Team (I work along with 6 other interns where we deal with media stuff and campaign work. Our new campaign this year is Ethnic Studies), and Watershed Ambassadors (I teach little elementary school students about the then and now of Oakland).
When I go to college I want to major in Cell Biology and then after college, I'd like to be a pediatric nurse.
My main hobbies are just hanging out with my friends, traveling, and just relaxing. I really enjoy traveling because there are so many new things that I've never seen before and I'm always open to learning about different cultures!
Chapter P Graphing Functions
During Chapter P, we reviewed some things that we learned from our previous math courses that would be applied in Math Analysis.
We had to do a project on graphing parent functions and performing translations on it. Some of the translations we did in this project was vertical shift, horizontal shift, and reflection across the x-axis.
My parent function was y=x^2.
- So the original equation is y=x^2 which is graphed in black.
- Then I performed a horizontal shift 7 units to the left so my equation was changed to y=(x+7)^2
- After the horizontal shift, I performed a vertical shift of 2 units up thus my equation came out to being y=x^2 + 2
- After my vertical shift up 2 units, I decided to shift it down 2 units from the original equation so it came out to be
y=x^2 -2 - After I did the horizontal and vertical translations, I decided to do a reflection across the x-axis so I multiplied the whole original equation by -1 so it came out to be y= -x^2
CH 0 Graphing Functions, Yunny Power
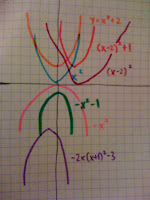
This project was based on the parent functions in Chapter P. We had to make transformations from the parent functions. The transformations we had to create were vertical translations, horizontal translations, and reflections across the x-axis and y-axis. The parent function that I will explain about is the squaring function, x2.
The original function x2 is in blue.
The vertical translation, function of y= x2 +2, is shown in orange. It was a vertical shift up 2 units.
The horizontal translation, function of y= (x-2) 2, is shown in magenta. It was a horizontal shift right 2 unit.
The vertical and horizontal translation, function of y= (x-2) 2 +1, shown in red. It was a horizontal shift right 2 unit, vertical shift up 1 unit.
The horizontal reflection, function of y= -x2, shown in pink. I flipped the parent function graph across the x-axis.
The vertical reflection, function of y= -x2 -1, shown in green. It was a reflection and vertical shift down 1.
The vertical shrink and stretch, function of -2x(x+1) 2 -3, shown in purple. It was a reflection, horizontal shift left 1, and vertical shift down 5 and vertical stretch by 2.
'
Wednesday, November 16, 2011
Ch. 1 Real World Functions
My real world function is about time and destination.
A function is a relation where each value in the domain has exactly one value in the range.
A relation is a set of ordered pairs (x,y).
The independent variable(x) of my function is the time.
The dependent variable(y) is the destination.
The domain is [7:00, 7:15, 7:28, 7:45].
The range is [Burger King, Safeway, Lucky's, Applebee's].
The graph on the left is a function because it passed the vertical line test. All values of x has exactly one value of y. The graph on the right is a relation because it failed the vertical line test. The x-value cannot have two outputs of y.
About Stephanie Ratio
Hi! My name is Stephanie Wong. The schools I previously attended were Cleveland Elementary and Edna Brewer Middle School. I am currently attending Oakland High School as a junior. I don't have a job but I have volunteered at the library and helped babysit my aunt's kids. Before, I wanted to become a nurse or a pediatrician since I like working with kids but now I am not sure. My favorite hobbies are spending time with family, hanging out with friends, and eating!
Tuesday, November 15, 2011
Real World Function
My real world function is the simple shape toys that children play with. For every specific hole on the box there is only one shape that would be able to fit through. This is an example a function, a function is a relation that says that for every x value (domain) there is a specific y value (range). In this toy you can't put another shape into a hole that doesn't belong to that specific shape,for example you can't fit a triangle into a hole made specifically for a circle, this is a relation, a relation is an ordered pair (x,y) that doesn't have anything specific.
Monday, November 14, 2011
Ch.1 Real World Functions
Chapter 1 Real World Functions
A function is a relation where each input have only one output . A relation is a set of order pairs.
Ch. P Graphing Functions by Ellie Cosine
First i translated the function 6 units down y=x^3-6, represented in light blue. Next i translated it to left 11 units y=(x+11)^3, represented in pink. Then i combined vertical and horizontal translations and shifted the function to the left 10 units and down 7 units y=(x+10)^3-y, represented in darker blue. Then i reflected the function across the x-axis y=-x^3, represented in green. Last but not least i combined vertical shift and reflection i moved the function down 9 units and reflected it across the x-axis y=-x^3-9, represented in purple.
Ch. 1 Real World Function
My real world function is based on the the temperature of the room and the temperature reading displayed on the corresponding thermometer. The independent variable is the temperature of the room and the dependent variable temperature reading displayed on the thermometer .The domains for both graphs are 55 degrees Fahrenheit to 75 degrees Fahrenheit. The range for both graphs are also 55 degrees Fahrenheit to 75 degrees Fahrenheit. The graph on the left is a function (expresses the intuitive idea that one quantity [input] completely determines another quantity [output]) because each temperature of the thermometer reading accurately corresponds with one temperature of the room. The graph on the right is a relation (a set of ordered pairs) because the temperature on the thermometer does not match the temperature of the room, one temperature of the room had more than one reading on the thermometer, failing as a function and resulting as a relation.
Ellie Cosine
Chapter 1, Real World Functions
A relation is where an independent variable can correspond with more than one dependent variable and does not pass the vertical line test.
In my graph, Each burger at McDonald's has their own price, but some burgers are also priced as a dollar via the Dollar Menu we all know and love. So now there are 3 - 4 burgers that are entirely different but they all cost one dollar. The independent variables, also called the domain, are the price of burger. The dependent variables, also called the range, are the type of burger.
Ch. 1 Real World Function
I did my real world function on a multicolored pen. The independent variables are the variables that control the dependent variable. The independent variables, or domain are purple, green, pink, orange, and blue which are the color of the switches. These are independent variables because they control what color of ink comes out of the pen. The colors of the switches are shown on the left side of the graphs. The dependent variables are the range, which are purple, green, pink, orange, and blue. These are dependent variables because their outcome depend on the independent variable. We can see that the top graph is a function because it always passes the vertical line test. Each domain has it's own value in the range. We can see that it's not a function because it does not pass the vertical line test, therefore it is a relation.
Ch.1 Real World Function
So I did my real world function on coins and the value of the coins. The Independent Variables are the Domain which is demonstrated by the name of the coin in this graph and the Dependent Variables are the Range which is the value in this case. The graph on the right is the Function graph and on the bottom it is a Relation graph. To tell the difference between 2 graph is rather if the graph passes the vertical line test which in this graph the dotted lines. Clearly we could see the bottom graph doesn't pass because the coins represented both value which could never happens. So when the graph doesn't pass it will be a Relation for Graphs that does pass it is a Function.
Ch 1 Real World Functions
A function is a relation where an independent variable corresponds with exactly one dependent variable and passes the vertical line test.
A relation is where an independent variable can correspond with more than one dependent variable and does not pass the vertical line test.
In my function graph, each country has their own flag. However, Korea has two flags (one for each sovereign state N. Korea and S. Korea) as shown in my relation graph. The independent variables, also called the domains, are the countries. The dependent variables, also called the range, are the flags.
My real world function is on the color of passport and the meaning/status of the color. A function is a set of points in where every x-input have only one y-output. A relation is a set of ordered pairs.
The Independent Variable/Domain of my real world function is the color of the passport or the x-inputs.
The Dependent Variable/Range of my real world function is the status of color or the y-output.
The top graph represents a function in which every x-input have only one y-output and that it passes the vertical line test.
The bottom graph represents a relation in which every x-input have more than one y-input and it fails the vertical line test.
Sunday, November 13, 2011
Ch. P Graphing Functions By: Timmy Line
About Yu Peng Circle
Ch 1 Real World Function
Ch 1 Real World Functions
A Function is a set of ordered pairs where for every input (X), there are only one output (Y).
The Dependent Variables are the Range of the Relation/Function which are represented by the Y-Values (Output).
CH1 Real World Function
Every time we turn the page in the book, we land on a certain section of a certain chapter, and in this case, I chose chapter 1.
For my example of a function (on the left) there are a certain amount of page numbers to be turned to end up on a certain section, but every time i flip a certain amount of pages to get to a chapter, I always started in the beginning page. A Function is a set of all points (x,F(x)) where each input as "x" has exactly one output which is represented as Y or F(x).
For my example of a Relation (on the right) which is a set of ordered pairs, which is not a Function, I used the same book to flip 70 pages to get to chapter 1.1, ;however, when I flipped 70 pages again, I did not land on chapter 1.1, i ended up on chapter 1.5, and when I flipped 70 pages again, I was found on a whole new chapter. This shows that it is not a relation because for every 70 pages i turn, i get more than one output, which goes against the rule of a function having one output for every input, in addition, it also fails the vertical line test, therefore, it is a relation.
The Independent variable in these two graphs are the page numbers, and the dependent variable were the sections of the chapter.
Ch1 Real World Functions
In this function, countries and their populations in 2010 are being compared.
A function is when the values of the domain produce only 1 range value.
A relation is a set of ordered pairs.
In the function, each country only has 1 population.
It fails as a function when the countries have more than 1 population, which is impossible. It becomes a relation.
The independent variables are the countries.
The dependent variables are their populations.
The domain is {China, India, US, UK, Russia, Mexico}
The range is [100k, 1.3m] because the lowest population in the 6 countries chosen is 100k(U.K) and the highest is 1.3m(China).
Ch 1 Real World Function
The graph on the bottom is also about the pay and work but it is a relation since it showed for some x-values, there are two to three y-values on a point.
A relation is a set of ordered pairs (x,y).
A function is a relation for which each element of the domain (x) corresponds to exactly one element of the range (y).
The independent variable is the places of work.
The dependent variable is the amount of pay for work.
Domain - [Happy Teeth, Youthful Teeth, Western Dental, Central View]
Range - [12.67-20.78]
Saturday, November 12, 2011
Ch 1 Real World Functions
- The graph on the left is a function because for every x-value, only 1 y-value responds and it passes the vertical line test.
- The graph on the right is a relation. This graph is only a relation and not a function because the x-value hits the graph at 2 point which shows that it didn't pass the vertical line test.
Ch 1 Real World Function
For my real world function I decided to do mines on one phone number goes to one person. The domain for this function is ( 511,777-3333,596-3700) . The range is the (Info. place, Oakland police department, Emerville police department). Definition for function is a relation that associates each value in the domain with exactly one value in the range. The first graph to the left is a function because there is exactly one domain for each one range. Not a function would be that if your phone is acting up and when you call one person your phone is calling three people at the same time when you only dialed one number. As you can see there is a second graph and the second graph isn't a function because there is only one domain for all the ranges. Definition of a relation is a set of ordered pairs of real numbers. The independent variable in this function is the phone number that you are dialing. The dependent variable is the person who picks up.
Ch 1 Real World Functions
Function: is a relation meaning each domain will have a range.